Seven months since the first COVID-19 case was reported in Southeast Asia and five months since lockdowns of various kinds and names became part of everyone’s lives, a good number of people are experiencing fatigue over figures, an overload of statistics, around the pandemic.
But COVID-19 has not been just a nasty typhoon that wreaks damage, then moves on. With no full treatment protocol or effective and safe vaccine, the pandemic persists even if many daily counts have now become weekly updates and statistics do not hog the headlines as they did months ago. Because COVID-19 is sticking around, the ability to process data around it is even more of a life skill amid at-times competing ‘conclusions’ about what they mean. It is certainly a lifesaving tool for individuals, as well news audiences, to make independent, informed decisions during these times.
Below are six tips for making our way through COVID-19 numbers:
1 Total cumulative cases of COVID-19 are often cited, but do not tell the whole story or allow for good comparison and too-quick conclusions about severity.
Is a country with more total cases worse off? Could be, but this first needs to be seen along other factors, as total confirmed cases are but one part of the story. Total confirmed cases acquire depth and fuller meaning against the backdrop of a country’s population size, speed and trend of growth (or changes) in cases over time, among others. A country may rank high in total cases, but have a less severe burden when its population size is factored in. This measurement of prevalence – proportion of cases in the population at a given time (100,000 people) – describes how widespread a disease is.

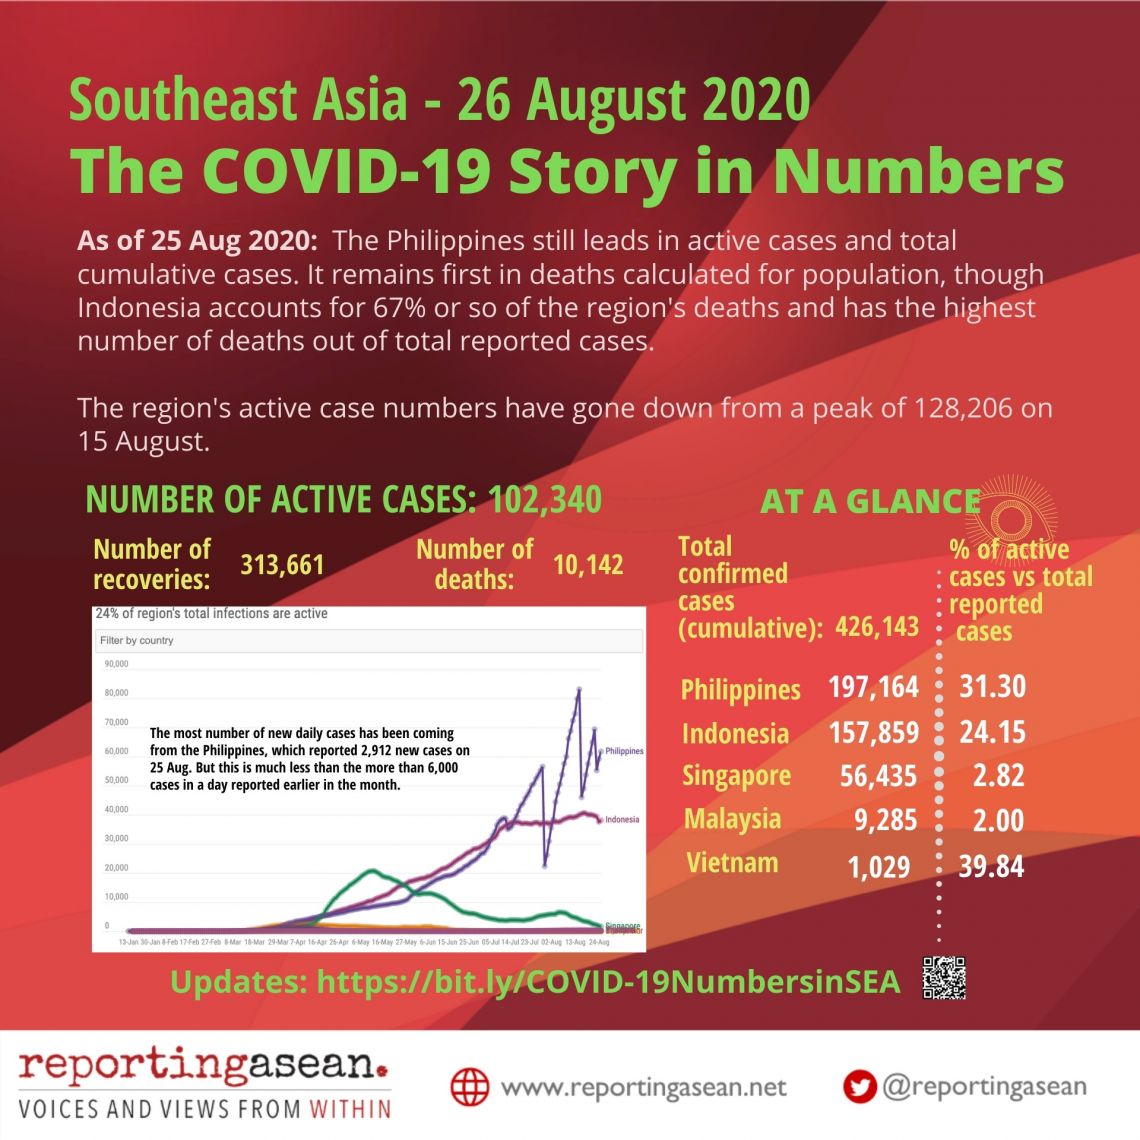
In ASEAN, Brunei has some 437,500 people and Indonesia has 274 million, so comparing gross COVID-19 figures does not work. Countries’ rankings may change when they are arranged by number of reported cases per 100,000 people. So while Singapore ranks third in Southeast Asia in total reported cases, it is first in terms of cases adjusted for population size (1,001 cases per 100,000 people on 25 August).
Even if a country starts to have fewer new cases daily, its cumulative figure will still go up since it adds from the first reported case onwards. The growth factor of cases would say more about the pandemic’s ‘pace’. “Case counts are only meaningful if we also know how much testing a country does,” according to the Our World in Data dashboard on COVID-19, which is run by Oxford University and Global Change Data Lab.
2 A more current description of the prevailing COVID-19 situation in a country lies in the number of still-active cases out of total cumulative cases.
‘Active’ means cases that are ongoing, unresolved, have not yet been reported or classified as recovered or died. Active cases don’t necessarily refer only to people in hospital (not all positive cases need confinement), and countries can have varying definitions. Active cases are those that remain in the pending folder, so to speak.
Lower proportions of active versus total cases are desirable, and a decline would show progress – a trend evident in countries with better recovery rates and lower mortality rates, such as Singapore and Thailand. Thailand has 3,401 confirmed cases, of which 108 or 3.17% are active (its count uses the phrase ‘receiving medical treatment’), as of 26 August.
Different country definitions of ‘active cases’ can affect COVID-19 counts – and a decline in active numbers usually goes with a rise in recoveries (assuming there is not a surge in fatalities). In some countries’ dashboards, a person who fares well is moved out of the active list to recoveries after a 30-day period. But in the Philippines, for instance, a person is defined as having recovered after a shorter period of 14 days’ quarantine (or when he or she tests negative). The moving by the Philippines, which has the most active COVID-19 cases in Southeast Asia, of huge cases numbers from the ‘active’ to the ‘recovered’ file led to very steep rises and plunges in its daily graphs. On a single day at end-July, it moved more than 37,000 active cases to the recovered list, and did the same for some 42,000 cases in one day in mid-August.
What does this tell us? It means that changes in classifications and definitions lead to adjustments that may look like progress, but are more mathematical shifts rather than a record of actual improvements on the ground.
3 We check mortality figures to gauge the likelihood of a person with COVID-19 dying from it, but there are limitations to what can be interpreted from these because the pandemic is still raging.
As in total cumulative cases, holding the number of total deaths up against other factors, including population size, provides a more contextualized picture.
The two usual datasets around fatalities are first, the current case-fatality ratio (CFR or number of deaths divided by reported absolute case numbers at a certain point) and second, fatalities per 100,000 people (general population, which comprises both confirmed cases and healthy people). The first set of figures shows the number of deaths against total confirmed cases at a point in time, and the second sets them in the context of population, which allows for comparison across countries.
Countries that score higher in these two yardsticks have the most deaths proportionally to their diagnosed COVID-19 cases or population sizes — but not necessarily the most number of deaths.
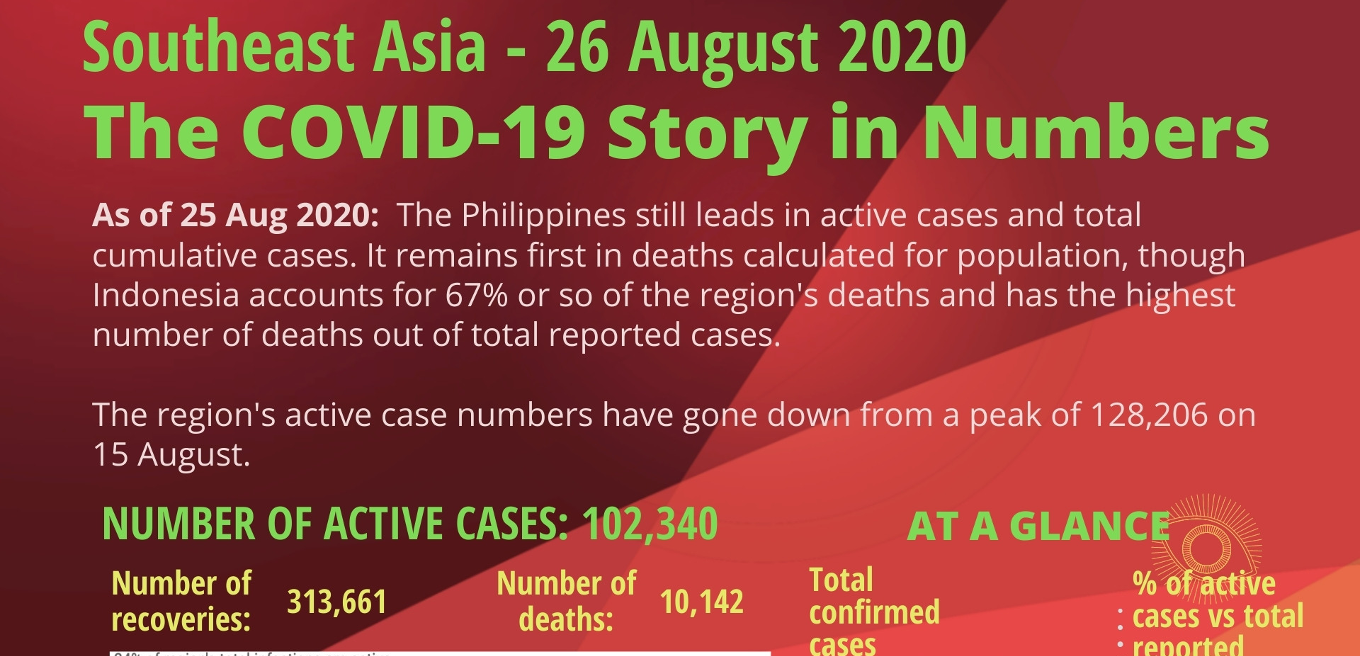
Take the Philippines and Indonesia, the two Southeast Asian nations hardest hit by COVID-19. As of 26 August, the Philippines’ CFR was 1.5%, lower than Indonesia’s 4.3%, but it had the highest deaths per 100,000 people in the region at 2.85, compared to Indonesia’s 2.56 (Indonesia accounts for 67% or so of the region’s deaths.) They are also the only Southeast Asian countries among the top 20 nations most affected by COVID-19, going by the Johns Hopkins University’s Coronavirus Resource Center. (Globally, the highest CFR is Mexico’s 10.8% and the most number of deaths per 100,000 population is Peru’s at 86.48, on 26 August.)
Respected sources such as the COVID-19 dashboards of Johns Hopkins University and Our World in Data, caution that CFR has limited use in defining risk. It does speak of disease severity but cannot be separated from its particular context, time and population. “During an outbreak of a pandemic, the CFR is a poor measure of the mortality risk,” explained the Our World in Data backgrounder on mortality.
As a pandemic rages, the numerator and denominator in the case-fatality formula – number of deaths and total confirmed cases – keep changing. Total case load is usually conclusive after a pandemic – a hundred deaths out of 10,000 cases paints a radically different picture from the same 100 deaths out of 100,000.
[‘Our World In Data’s section on mortality risk adds that crude mortality rate is different, and measures the probability that any person (not just infected ones) will die from a disease. It says the statistic we need – to answer the question ‘how likely is someone infected with COVID-19 to die’ – is the “infection fatality rate”, obtained from dividing number of deaths by final case numbers. An accurate figure for this is not yet possible as the number of total COVID-19 cases is not known, partly because not everyone with the virus is tested.
Amid the limitations of case-fatality rate, some groups have made efforts to compare a country’s deaths during a pandemic with its usual mortality rates, from all causes, in previous years. Computing for this “excess mortality”, which is the number of deaths above and beyond what is expected in non-pandemic situations, is an attempt to catch under-reporting of death figures, especially in settings with inadequate testing.
4 Testing is far from a simple story. It is crucial to the quality and context of other statistics, including a country’s total reported cases, which are in turn used to derive other figures.
RT-PCR (reverse transcription-polymerase chain reaction) testing needs to be done on an adequate scale, degree, with sound policy, against the size of a country’s outbreak, in order to be of most use in pandemic response. What is adequate, smart testing?

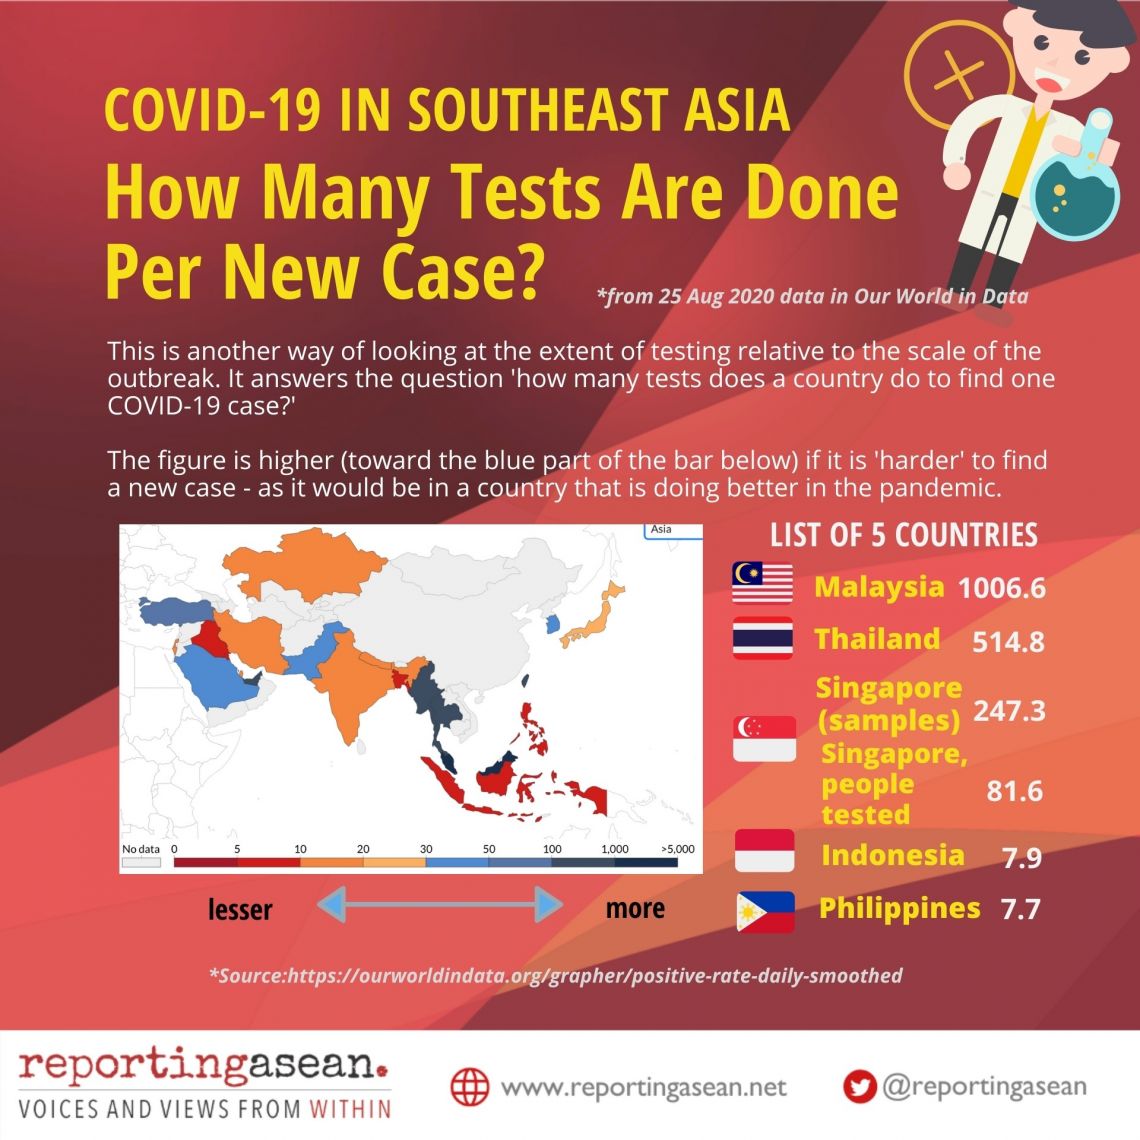
The World Health Organization (WHO) has suggested a positive rate lower than 10%, but better lower than 3%, as a benchmark of adequate testing. Countries that do very few tests per confirmed case are unlikely to be testing widely enough to find all cases. (See infographic called ‘How Many Tests Are Done Per New Case?’) Cases are likely going unreported if a country is testing too little versus its outbreak – that is, daily tests versus daily new confirmed cases per million people. Comparing testing to size of outbreak, beyond population size, is a major indicator. Having the most number of tests per million people is another matter from whether these tests are adequate for the scale of a country’s outbreak.
Could more tests account for more positive cases? It is one factor given that the deeper one digs, the more cases one may find. But the percentage of positives among total testing would be a telling and weighty factor.
In terms of testing rates versus population size, the Philippines has .29 tests per thousand (22 August), Indonesia .06 per thousand (25 August). These figures lag far behind those of the countries with the highest testing numbers of, say, 5 to 7.21 per thousand people.

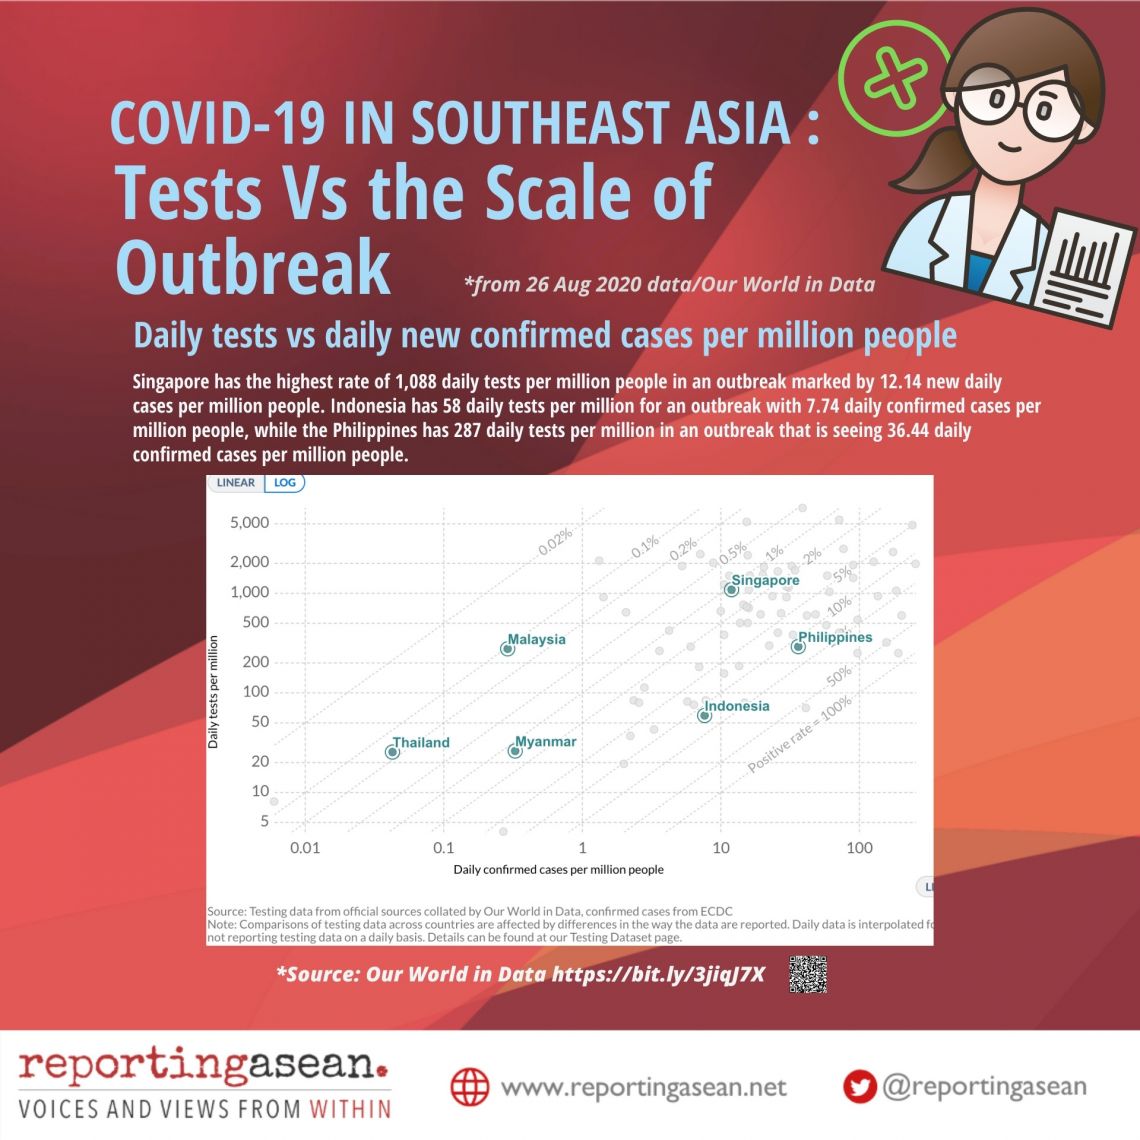
By scale of outbreak, the higher and further to the right a country is in the chart on ‘Tests Vs the Scale of Outbreak’, the better it fares in the measure of daily tests per million people versus daily new confirmed cases per million people. Indonesia has 58 daily tests per million for an outbreak with 7.74 daily confirmed cases per million people, while the Philippines has 287 daily tests per million in an outbreak that sees 36.44 daily confirmed cases per million people. By number of people tested, Singapore has the highest rates at 1,088 daily tests per million people in its outbreak, which sees 12.14 new daily cases per million people.
5 To know better how transmissible the virus is, checking the positivity rate in COVID-19 tests and the basic reproduction number would be helpful in shaping the decisions people need to make during the pandemic.
The positive rate is the number of positive results from total tests, which can be reported as tests per day or cumulatively from the first COVID-19 case. It gives information about the virus’ spread, which is useful for making decisions around mobility. With adequate testing levels and scale, a decline in positivity is more welcome than the reverse, which suggests the virus is spreading faster. In countries with a high positive rate, the number of confirmed cases is likely to represent only a small fraction of the true number of infections, according to Our World in Data.
In terms of positivity rates from daily tests in Southeast Asia, the Philippines has the highest at 13% positivity and Indonesia 12.70%, as of 25 Aug, going by weekly rolling averages.
WHO defines a 5% positive rate or under as one indicator that a country is more able to control a pandemic. It advises that countries with daily positive rates of 5% or below, for at least two weeks, can more safely reopen economies – a level that Indonesia and the Philippines remain far from.
The reproduction number (‘R naught’) is an estimate of how many people are being infected by one person. The further up it is from 1 (one person infecting one other person), the more worrisome it is. An outbreak is considered under control if R naught stays at less than one. On 20 August, Jakarta Governor Anies Baswedan said the COVID-19[reproduction number in the Indonesian capital stood at 1.09. The Philippines’ reproduction number reached 1.61 in early August (it peaked at 2.62 in March), but eased to 1.1 and further to .963 on 23 August, according to data from the University of the Philippines COViD-19 dashboard] and experts from the same university.
6 The severity of COVID-19 is not defined by just a single statistic. If pandemic management were an orchestra, the various instruments in it need to make good harmony, that is, produce more effective responses.
The skill to evaluate key indicators can help individuals and communities make better decisions about their actions, and address their vulnerability in various settings. Caveats and context are part and parcel of statistics, and do not make them less important or valid. But it is easy to forget that when country and global dashboards use reported confirmed cases, they are in reality ‘the cases that we know of’ since tests were conducted on these people. In sum, ‘confirmed cases’ are not ’total actual cases’. Actual cases would number more than the confirmed cases being reported at present.
“In the COVID-19 pandemic we are in the unfortunate situation that the number of total cases is not known. Only a fraction of total cases – those confirmed by a test – is known,” the Our World in Data section on the global pandemic situation pointed out.
But progress is possible, as Our World in Data says, and some countries have managed better. Improvements show in several statistics, such as an easing in new cases and growth factors, more recoveries and fewer deaths, falling transmissibility of the virus.
“To end the coronavirus epidemic, we have a clear and simple goal: cases need to go to zero everywhere,” Our World in Data’s researchers said. “Only if we end the pandemic everywhere can the pandemic end anywhere.”
(Johanna Son is founder and editor of the ‘Reporting ASEAN‘ series. Since March, she and colleague Yvonne T Chua, have been following the COVID-19 story in numbers in Southeast Asia. This article is part of Reporting ASEAN’s ‘Stories Behind the COVID-19 Series’, in partnership with Splice.)
Reporting ASEAN’s tracker charts (general figures and testing) are here.


