By DINNA LOUISE C. DAYAO
The extraordinary thing about Republic Act No. 10586 or the Anti-Drunk and Drugged Driving Act of 2013 is that it was enacted despite the lack of coherent data on drunk driving in the country.
For years, three government agencies have been gathering data on road traffic injuries and deaths: the Department of Health, the Philippine National Police (PNP), and the Metro Manila Development Authority (MMDA). The data they collect include the number of injuries or crashes that can be blamed on alcohol.
However, they are like blind men trying to describe the same elephant. This is because each agency has its own definition of data to capture and its own collection method. Each one gets its data from different sources; and all the data are not integrated in one system.
ALARMING FIGURES
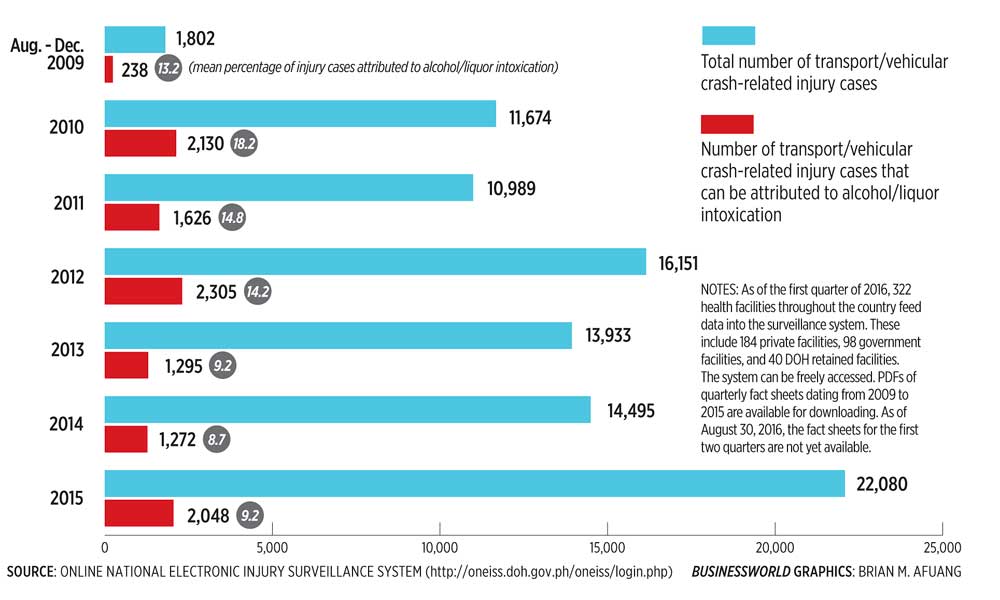
The data culled from the Department of Health’s Online National Electronic Injury Surveillance System show much cause for concern. From 2009 to 2015, alcohol topped the list of risk factors at the time of the incident. During that period, alcohol led to 10,914 injury cases.
The system can be freely accessed. PDFs of quarterly fact sheets dating from 2009 to 2015 are available for downloading. As of Aug. 30 of this year, the fact sheets for the first two quarters were not yet available.
Hospital staff members are trained in the surveillance system; they accomplish the patient injury forms and encode entries. They ask respondents to rank the “risk factors at the time of the incident.”
The six risk factors are:
• “Alcohol/liquor”;
• “Smoking”;
• “Drugs”;
• “Using mobile phone”;
• “Sleepy”; and
• “Others (e.g., suspected under the influence of substance used).”
Hospital staff also observe if the patient involved in the crash shows signs of intoxication, such as the smell of alcohol on his or her breath. However, they do no chemical tests for blood alcohol content to confirm their impressions. It is not yet standard practice in Philippine hospitals to conduct such tests.
A FALSE ESTIMATE
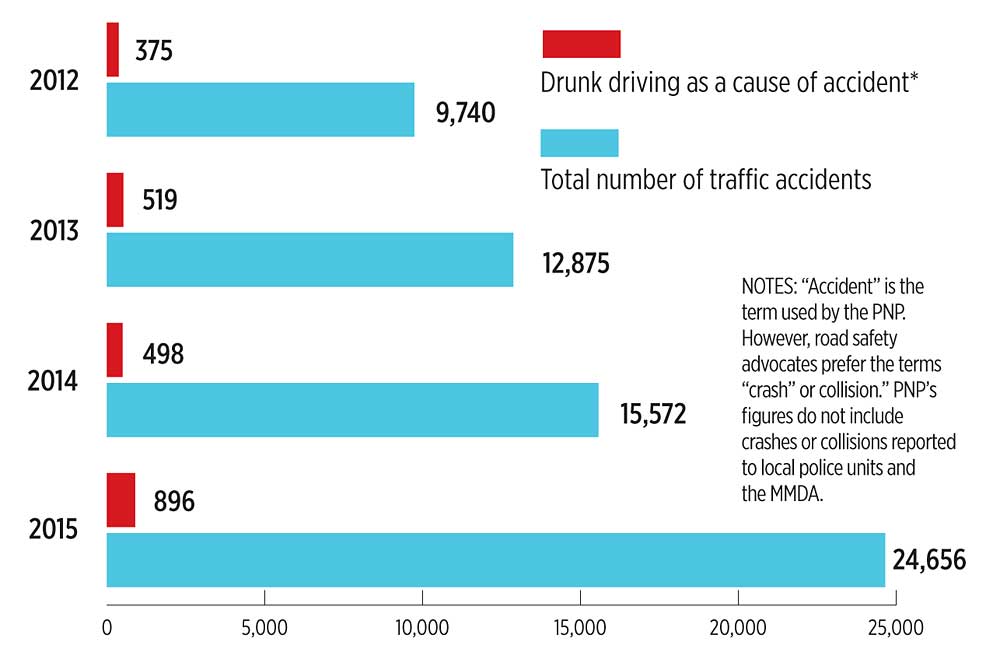
The figures from the PNP — specifically, from the regional offices of the Highway Patrol Group — show that the number of crashes caused by drunk driving has gone up from 375 in 2012 to 896 in 2015 (see graphics).
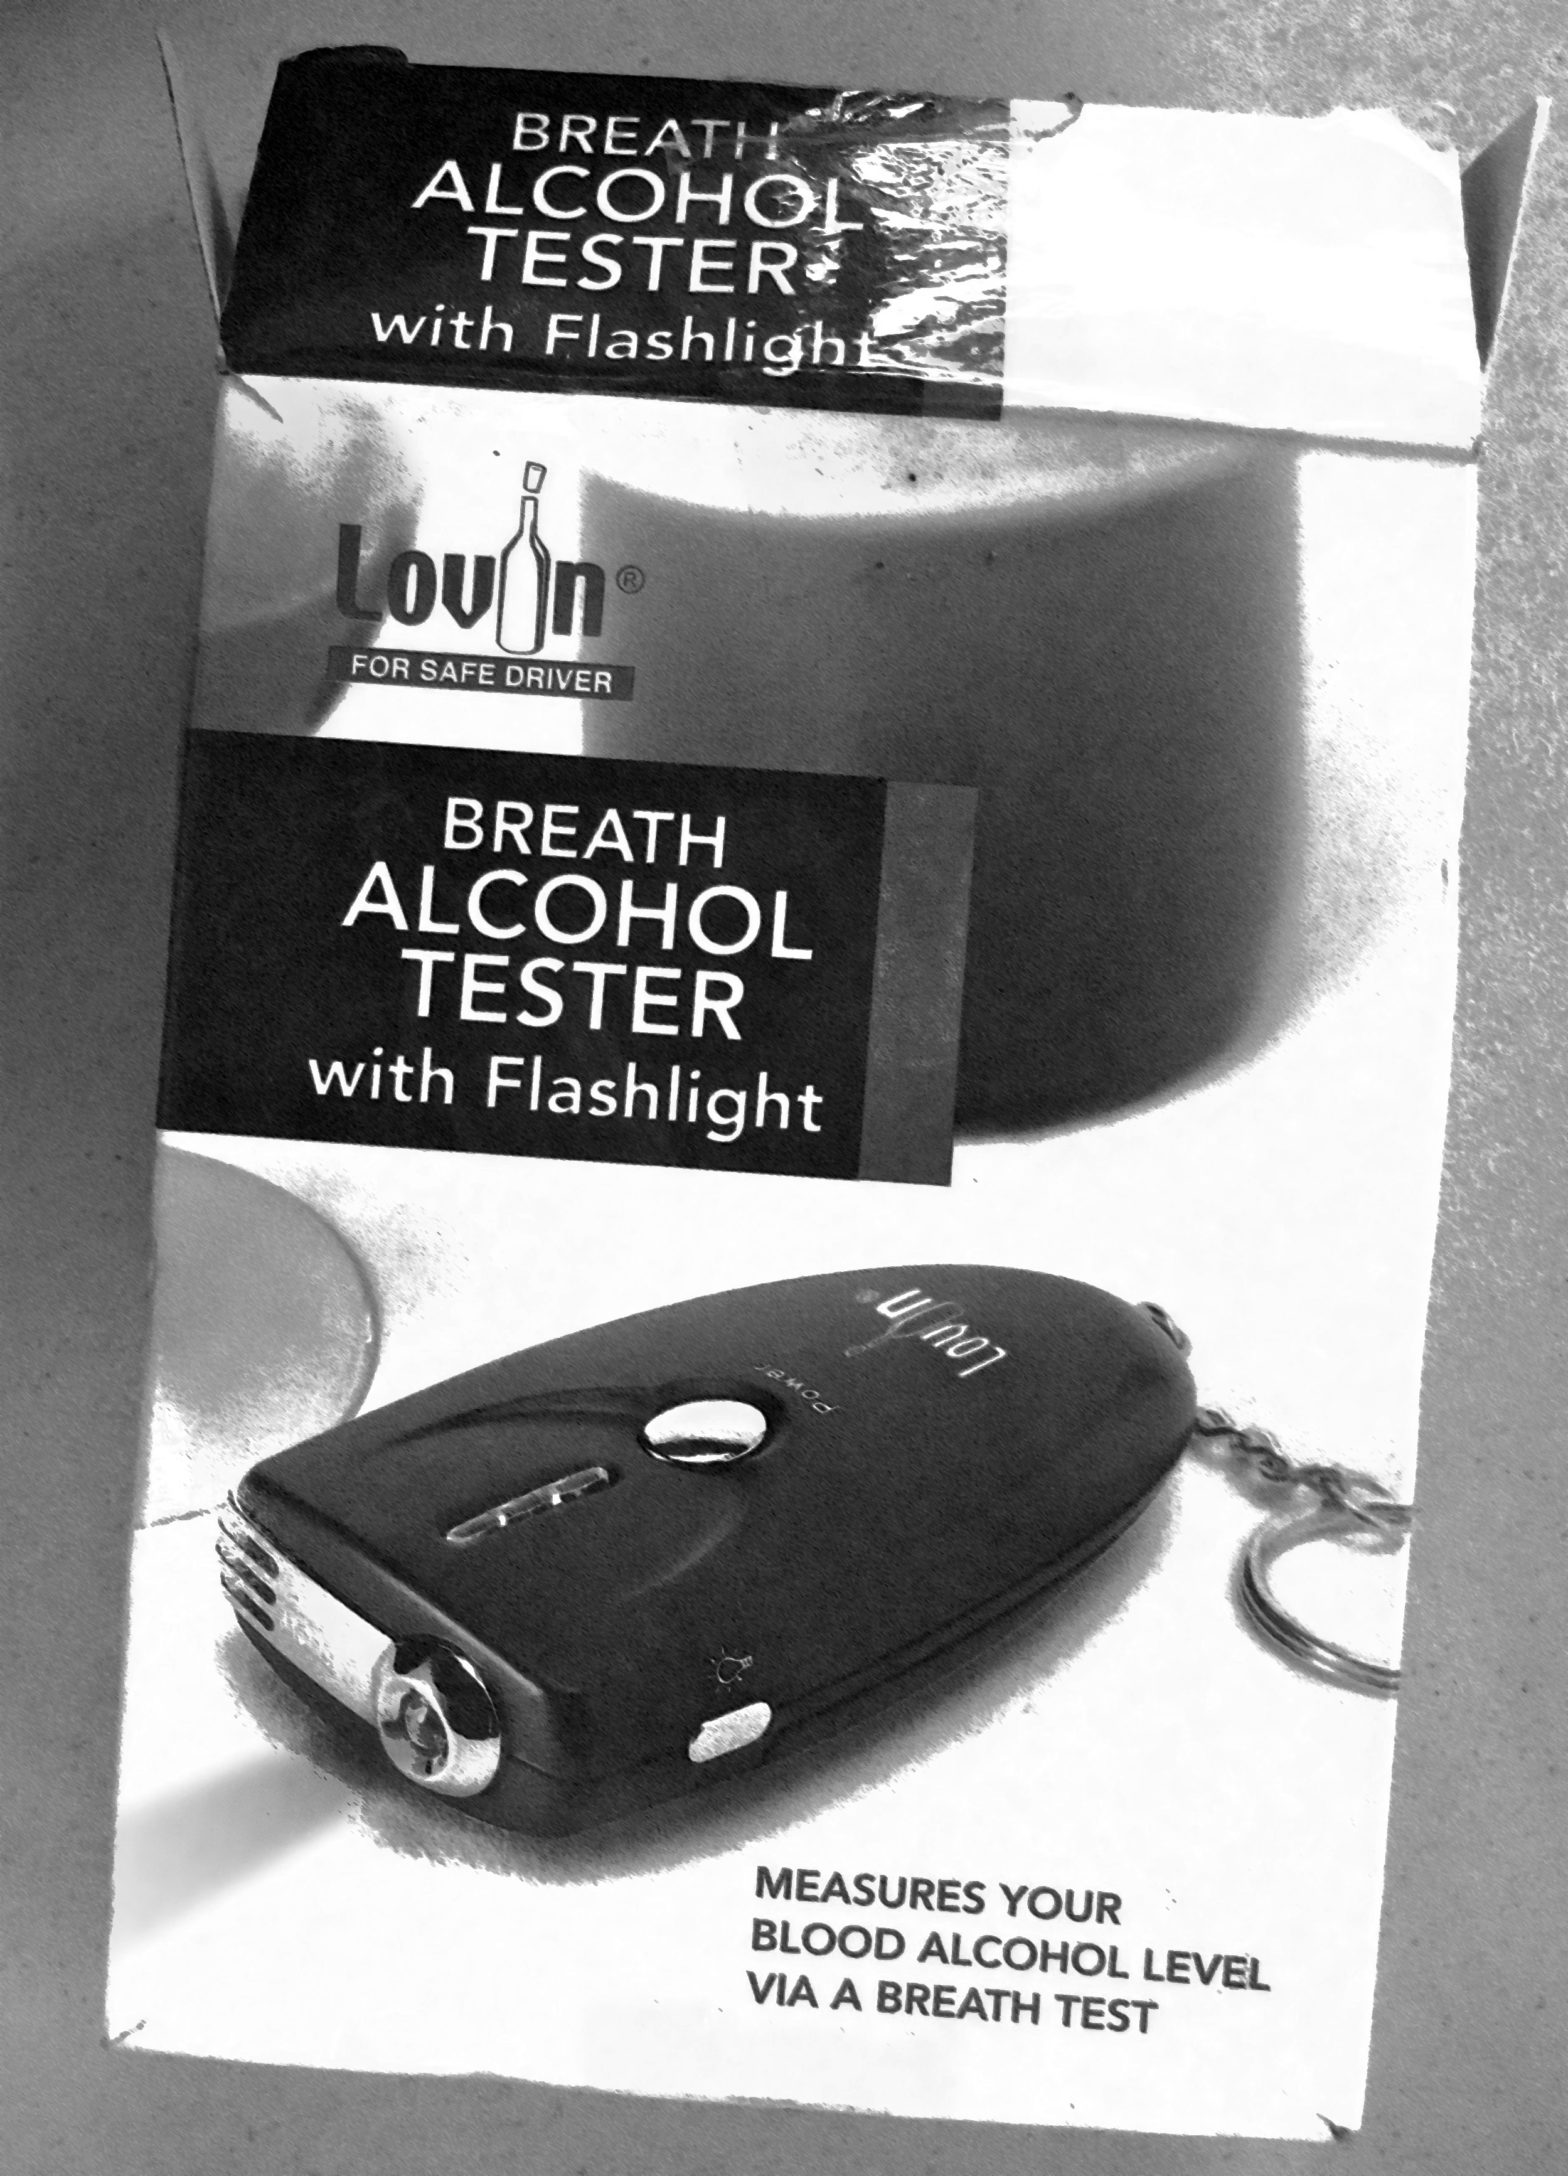
However, it is unclear how the PNP determined that alcohol was the cause of the crash. There are only 150 alcohol breath analyzers in the entire country. The dearth of breathalyzers has tied the hands of many law enforcers, including those at the PNP.
In 2006, the PNP Traffic Management Group estimated that 1% of road traffic deaths involved alcohol. This is the percentage cited in the World Health Organization’s Global status report on road safety 2015. In the report, the World Health Organization (WHO) estimated that 10,379 people died on Philippine roads in a year. Therefore, using PNP’s estimate of 1%, 103 people died in alcohol-related crashes.
However, that estimate is misleading. “Having 1% of deaths on the road attributable to alcohol seems very low when compared to other countries in the region,” said Dr. Tamitza Toroyan, technical officer at the WHO. Dr. Toroyan is the coordinator of the WHO report.
“What the WHO recommends is that all drivers killed in a crash are tested for alcohol,” she said. “That doesn’t happen in the Philippines yet. If you only test some drivers, you will, of course, report a lower percentage of deaths attributable to alcohol than what it may actually be.”
UNRELIABLE DATA
The figures from the MMDA paint a hazy picture. The agency collects data on “accident factors.” In its Metro Manila Accident Recording and Analysis System (MMARAS) 2015 report, the list of “human errors” included “alcohol suspected,” “driver error,” and “avoided hitting animal.”
The agency has data on “(alcohol suspected)” resulting in fatal and non-fatal injuries. Adding up MMDA’s figures for “accident factor: human error (alcohol suspected) resulting in fatal injuries” for the years 2013 to 2015 gives a total of one fatal injury. During the same period, there were 1,348 crashes that resulted in deaths.
On the other hand, totaling the numbers of “accident factor: human error (alcohol suspected) resulting in non-fatal injuries” for the years 2013 to 2015 comes out to 67 non-fatal injuries. During the same period, there were 50,506 crashes that resulted in non-fatal injuries.
According to the 2015 report, MMDA’s road safety unit gets data from two sources:
• Individual report forms for each accident, gathered by the unit’s eight data researchers from different stations and district offices of the traffic enforcement unit of the Philippine National Police; and
• Recorded road crashes at MMDA’s Metrobase through radio calls, concerned citizen calls, and CCTV footage.
MMDA’s data collection system may result in missing data and under-reporting, as the agency itself noted in the section on “known deficiencies” in the 2015 report.
Pia Faustino, a data analyst at consultancy Thinking Machines, would agree. She was part of a team that analyzed more than 10 years worth of data — from 2005 to August 2015 — in the MMARAS. At the time, the database contained information on more than 785,000 traffic incidents that took place in Metro Manila.
“Only about 15% of the incidents in the MMARAS have any information about possible causes of crashes,” said Ms. Faustino. “And the ones with alcohol indicated are even fewer. Unfortunately, the data is probably not reliable.”
WANTED: INTEGRATED DATA
The WHO defines a road crash fatality as any person killed immediately or dying within 30 days as a result of a road crash. The choice of 30 days is based on research that shows that most people who die as a result of a crash succumb to their injuries within 30 days of sustaining them.
But the Philippines “doesn’t have a way to link up its health data with the police data,” said Dr. Toroyan. “If someone dies after a crash, say, four weeks later, that death is probably not being captured by the police data.”
What the country should have is a way for the hospital records to link with the data in the police registers, she said. “In Cambodia, they have a way to get all the data from the health system and cross tabulate them to make sure there are no repeats with the police data.”
Better data collection would also allow stakeholders to design interventions that address the people who are most at risk of drinking and driving. “Let’s say you have data that shows that 40% of the people drink-driving are young men between the ages of 20 and 40,” said Dr. Toroyan. “If you’re going to do a drunk driving campaign, you can target this group of young men.”
This story first appeared in Business World, and was produced under the Bloomberg Initiative-Global Road Safety Media Fellowship implemented by the World Health Organization, the Department of Transportation and Communications, and VERA Files.