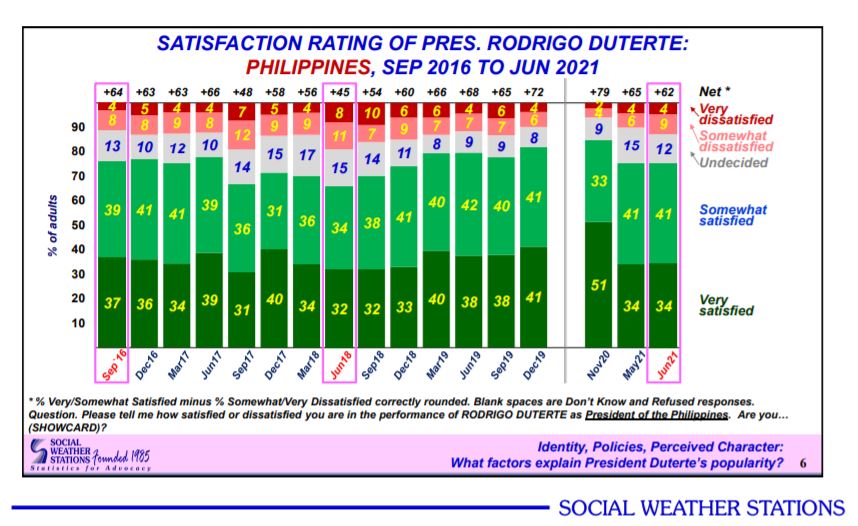
The results of the latest SWS Third Quarter 2017 Survey show that the overall satisfaction rating of President Duterte stands at 48% (67% satisfied, 14% undecided, and 19% dissatisfied). Some 48% more Filipinos are satisfied than dissatisfied with President Duterte’s performance as President.
However, the results show that the much awaited tipping point in public opinion on the administration of President Duterte may have been reached, as the current ratings represent a drop of 18% net satisfaction from the second to the third quarter, after an upward trend (4% increase) from the first to second quarter.
This reversal of the trend in net satisfaction ratings come almost 15 months after President Duterte assumed office. It comes at a time when he has covered just over 21 percent of his term of office.
The latest SWS survey is the third in a series for 2017. The SWS conducted its First Quarter Survey (1QS) on March 25-28, its Second Quarter Survey (2QS) on June 23-26, and its Third Quarter Survey (3QS) on September 23-27.
The main insights are:
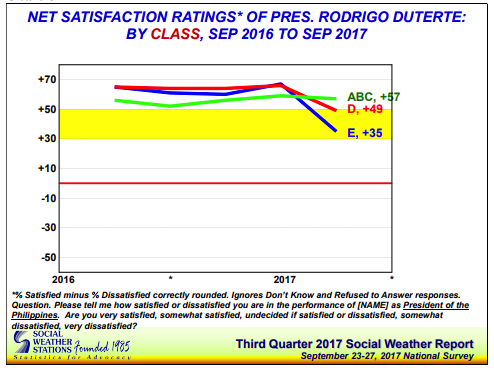
The poor are most exasperated. The poorest class, Class E, is least satisfied with Duterte’s performance (net satisfaction of 35%). They also show the most precipitous drop in satisfaction rating between the 2Q and 3Q surveys (32%). This is the largest socio-economic class, and should be watched closely. This is where the Kadamay, and the Marcos wealth redistribution hopefuls come from.
The Filipinos from Luzon outside of Metro Manila feel most neglected. Filipinos in the rest of Luzon outside of Metro Manila are the second least satisfied (net satisfaction rating of 36%) with the performance of President Duterte. This was a drop of 22% from the 2Q survey net satisfaction rating of 58%. The 1Q survey rating of 51% was the lowest for that quarter. Apart from being sidelined in the discourse on major projects for the south, this may also be partly because Balance Luzon contains the support base of the former President (PNoy) and the current Vice-President (VPLeni).
Mindanaoans continue to be most upbeat. Across the 3 quarters, Mindanaoans have consistently had the highest rating for President Duterte, starting with a high 87% net satisfaction. This dropped by 12% between the 1Q and 2Q surveys, the highest drop across all socio-demographic groups for this period. Between the 2Q and 3Q surveys, there has been no significant change. Military action in Marawi seemed a justifiable man-made disaster. The promptness and adequacy of the rehabilitation effort will likely be an eye-opener for Mindanao.
The rich feel most confident and secure. Across the 3 quarters, Class AB respondents gave the second highest net satisfaction rating, although the rating stands almost 20% lower than the Mindanaoan rating. The changes in ratings are very small: 3% between the 1Q and 2Q surveys, and only a reduction of 2% between the 2Q and 3Q surveys. The stability in the ratings suggest the Class ABC feel impervious to natural and man-made adversities and disasters, and see opportunities in any regime. They believe their political and economic safety nets are regime change tested to be reliable.
Metro Manilans best reflect the social climate. NCR respondents had mean initial ratings (64%). This increased insignificantly to 66% in the 2Q survey, and dropped 18% in the 3Q survey. This also best exemplifies the national trend. The NCR may well be the bellwether of Filipino public opinion as far as Duterte is concerned.
Filipinos remain hopeful, but show clear signs of worry. Overall, Filipinos gave a 63% net satisfaction rating to President Duterte. This remained unchanged in the 2Q survey, but dropped 18% in the 3Q survey. Three quarters of the same rate of drop will bring President Duterte’s satisfaction rating into negative territory, which means more people are dissatisfied than satisfied with his performance. Dramatic positive changes will need to be visible over the next six months if President Duterte will reverse this trend.
Here are specific observations on each of the socio-demographic groups. For convenience in comparing across all groups, the ratings are arranged from highest to lowest, using the 3Q survey results as reference. The socio-demographic grouping that hews closest to the national pattern in its category is shaded.
|
Socio-Demographic Group |
Net Satisfaction Ratings (%) |
Comment |
||||
|
1Q |
2Q |
3Q |
2Q-1Q |
3Q-1Q |
||
|
Mindanaoans |
87 |
75 |
76 |
-12 |
1 |
Across the 3 quarters, Mindanaoans have consistently had the highest rating for President Duterte, starting with a high 87% net satisfaction. This dropped by 12% between the 1Q and 2Q surveys, the highest drop across all socio-demographic groups for this period. Between the 2Q and 3Q surveys, there has been no significant change. Military action in Marawi seemed a justifiable man-made disaster. The promptness and adequacy of the rehabilitation effort, still to unfold, will likely be an eye-opener for Mindanao. |
|
Class ABC |
56 |
59 |
57 |
3 |
-2 |
Across the 3 quarters, Class AB respondents gave the second highest net satisfaction rating, although the rating stands almost 20% lower than the Mindanaoan rating. The changes in ratings are very small: 3% between the 1Q and 2Q surveys, and only a reduction of 2% between the 2Q and 3Q surveys. The stability in the ratings suggest the Class ABC feel impervious to natural and man-made adversities and disasters, and see opportunities in any regime. They believe their political and economic safety nets are regime change tested to be reliable. |
|
Some Vocational/ College |
60 |
62 |
56 |
2 |
-6 |
Clearly very satisfied with Duterte are respondents who have had some vocational or college education. They started with an initial rating below mean (60%), but did not show the sharp drop (average of 18%). They have ended up to be the third most satisfied group with President Duterte’s performance. They presumably have enough skills (e.g., as TESDA graduates) to be employed without having too high expectations as the college graduates. |
|
Age 25-34 |
71 |
67 |
53 |
-4 |
-14 |
This group exhibited the second highest net satisfaction rating in the 1Q survey, after the Mindanaoans. This age range is the entry to gainful employment. They were initially highly optimistic, perhaps experiencing the empowerment threshold of being financially independent. Between the 2Q and 3Q surveys, however, this group reports a 14% drop in net satisfaction. |
|
Age 45-54 |
64 |
58 |
53 |
-6 |
-5 |
This group experienced martial law (born between 1962 and 1972) as children or youth. They would perhaps be more open to alternative perspectives on martial law and less critical of Duterte’s declaration of martial law in Mindanao, and concerned about the possibility of martial law nationwide. This age group’s ratings are closest to the national ratings. |
|
Men |
65 |
63 |
49 |
-2 |
-14 |
Men have more appreciative ratings of President Duterte than the women. The trend has been a consistent downward slide from 65% (1Q), to 63% (2Q), and 49% (3Q). These men group’s ratings are closest to the national ratings. Men may be less disturbed by the rough talk of President Duterte and identify with an aggressive style to national problem-solving. |
|
Class D |
64 |
66 |
49 |
2 |
-17 |
Class D has mean net satisfaction ratings initially of 64% increasing slightly to 66% and dropping to 17% to a 3Q survey net satisfaction rating of 49%. Class D is the socio-economic class group that represents the mean pattern and the Philippine pattern. Class D have the economic assets, support network, and experience to thrive even in uncertain environments. |
|
College Graduates |
76 |
76 |
48 |
0 |
-28 |
College graduates had high satisfaction ratings at the start (76%). This is second only to the ratings of Mindanaoans. This rating remained until the 2Q survey, but dropped drastically by 28% to 48%. College graduates are the educational attainment group that has the closest pattern to the national pattern. College graduates are more capable and confident of actualizing any existing opportunities in the environment than those with lesser educational attainment. |
|
Urban |
63 |
68 |
48 |
5 |
-20 |
Urban respondents had mean-level initial net satisfaction ratings (63%). This increased slightly to 68% in 2Q, and dropped 20% to 48 in 3Q. This best exemplifies the national trend. No significant difference from rural ratings. |
|
Philippines |
63 |
66 |
48 |
3 |
-18 |
Overall, Filipinos gave a 63% net satisfaction rating to President Duterte. This remained unchanged in the 2Q survey, but dropped 18% in the 3Q survey. Three quarters of the same rate of drop will bring President Duterte’s satisfaction rating into negative territory, which means more people are dissatisfied than satisfied with his performance. Dramatic positive changes will need to be visible over the next six months if President Duterte will reverse this trend. |
|
NCR |
64 |
66 |
48 |
2 |
-18 |
NCR respondents had mean initial ratings (64%). This increased insignificantly to 66% in 2Q, and dropped 18% in 3Q. This also best exemplifies the national trend. The NCR may well be the bellwether of Filipino public opinion as far as Duterte is concerned. |
|
Rural |
63 |
63 |
47 |
0 |
-16 |
Rural respondents had mean initial ratings (63%), unchanged in the 2Q survey, and dropped 16% to 47%. No significant difference from urban ratings. This may be the effect of the pervasiveness of mass and social media communication. |
|
Women |
61 |
69 |
46 |
8 |
-23 |
Women have had lower satisfaction ratings, initially at 61%, increasing by 8% in the 2Q survey to 69%, and dropping drastically by 23% to 46% in the 3Q survey. It appears that the continuing verbal assault of President Duterte on women in government (De Lima, Sereno, Carpio-Morales) and his misogynistic reputation may have influenced these ratings. |
|
Age 55+ |
61 |
68 |
45 |
7 |
-23 |
Respondents in the age group 55+ were born in 1962 or earlier. They have gone through more administrations, and were at least 10 years old when martial law began. This group had satisfaction ratings close to the mean at the start (61%). This increased significantly by 7% to 68% between the 1Q and 2Q surveys. The voice of experience seem to say, Duterte is not performing as promised. |
|
Some Elem |
60 |
68 |
41 |
8 |
-27 |
Those who have only elementary education give President Duterte below mean ratings, initially at 60% during the 1Q survey. This significantly increased to 68% in the 2Q survey, but drastically dropped 27% to 41% net satisfaction in the 3Q survey. Elementary level respondents are relatively disadvantaged and marginalized and will require active inclusive policies and programs to satisfy. |
|
Age 35-44 |
59 |
59 |
40 |
0 |
-19 |
This group was born between 1973 and 1982, too young to remember martial law in a political and economic sense. This group is actively seeking income stability and security in their economic well-being and careers. As such, they are relatively insecure and unfulfilled. They registered a below mean net satisfaction rating of 59%. This remained the same in the 2Q survey, but dropped 19% to 40% in the 3Q survey. |
|
Visayans |
62 |
73 |
43 |
11 |
-30 |
The Visayans initially had mean net satisfaction levels at the start of the year (62%). This shot up 11% to 73% net satisfaction during 2Q. Then it plummeted -30% to 43% in the 3Q survey. The drop may have been accounted for by the sensational death of Baybay Mayor Rolando Espinosa and the intimidation of Mayor Jed Mabilog of Iloilo that ruffled the feelings of Ilongos. This is a group to watch closely in the coming months. |
|
Aged 18-24 |
59 |
59 |
40 |
0 |
-19 |
This is the youngest group of adult respondents. They may have been affected by the report of deaths of young innocent victims of the war on drugs and crime like Kian delos Santos and Carl Arnaiz. |
|
Some HS |
64 |
66 |
38 |
2 |
-28 |
Filipinos who had some HS education show lower satisfaction (38%) and the second highest drop from the 2Q to 3Q surveys (same as the college graduates). This may be a function of the higher expectations of economic opportunities that have not materialized, and of a greater ability to understand and discern trends in political and economic issues. This is another group to watch closely in the coming months. |
|
Bal Luzon |
51 |
58 |
36 |
7 |
-22 |
Filipinos in the rest of Luzon outside of Metro Manila are the second least satisfied (net satisfaction rating of 36%) with the performance of President Duterte. This was a drop of 22% from the 2Q survey net satisfaction rating of 58%. The 1Q survey rating of 51% was the lowest for that quarter. Apart from being sidelined in the discourse on major projects for the south, this may also be partly because Balance Luzon contains the support base of the former President (PNoy) and the current Vice-President (VPLeni). |
|
Class E |
60 |
67 |
35 |
7 |
-32 |
The poorest class, Class E, is least satisfied with Duterte’s performance (net satisfaction of 35%). They also show the most precipitous drop in satisfaction rating between 2Q and 3Q (32%). This is the largest socio-economic class, and should be watched closely. This is where the Kadamay, and the Marcos wealth redistribution hopefuls come from. |
|
Click here for the source of data analyzed. |
||||||
(The author, Dr. Segundo Joaquin E. Romero, Jr., is a Professorial Lecturer at the Development Studies Program of the Ateneo de Manila University.)
